Imagine a ship sailing through unpredictable seas. Traditional chaos engineering is like scheduling fire drills on calm days — useful practice, but not always reflective of real storms. Kubernetes often faces turbulence in the moment: pods fail, nodes crash, or workloads spike without warning.
Event-driven chaos engineering is like training the crew with surprise drills triggered by real conditions. Instead of waiting for disaster, it turns every unexpected wave into a chance to strengthen resilience.
In this blog, we’ll explore how event-driven chaos turns Kubernetes from a vessel that merely survives storms into one that grows stronger with each one. This blog builds an event-driven chaos engineering pipeline in Kubernetes, combining tools like Chaos Mesh, Prometheus, and Event-Driven Ansible (EDA).
Why Chaos Engineering?
Chaos engineering is the discipline of experimenting on a system to build confidence in its ability to withstand turbulent conditions in production. Traditional chaos experiments are often scheduled or manually triggered, which can miss critical windows of vulnerability or relevance.
For example:
- What happens when a node fails during a deployment?
- How does your system behave when a spike in traffic coincides with a database upgrade?
These scenarios are not just hypothetical — they’re real, and they often occur in response to events.
Read the blogs in this series to know more about chaos engineering and the comparison of traditional and event-driven.
Why Event-Driven?
Event-driven architectures are designed to respond to changes in state — be it a new deployment, a scaling operation, or a system alert. By integrating chaos engineering with these events, we can:
- Target chaos experiments more precisely (e.g., inject faults during high-risk operations).
- Reduce noise by avoiding irrelevant or redundant tests.
- Accelerate feedback loops for developers and SREs.
- Simulate real-world failure conditions with higher fidelity.
In essence, event-driven chaos engineering transforms resilience testing from a periodic exercise into a continuous, adaptive process. Think of it like fire drills: traditional chaos is “let’s pull the alarm at 2 AM every day,” while event-driven chaos is “when smoke is detected in a wing, trigger a drill immediately.”
Chaos Engineering: Traditional vs. Event-Driven
|
Traditional Chaos Engineering
|
Event-Driven Chaos Engineering
|
|
|
When it runs
|
Prescheduled experiments (e.g., daily, weekly)
|
Triggered in real time by actual events (e.g., pod crash, CPU spike)
|
|
Testing generic failure scenarios
|
Responding to live failures as they occur
|
|
|
Simulated conditions, not always reflective of production events
|
Mirrors real-world incidents and context
|
|
|
Identify weak points through periodic stress
|
Build adaptive resilience by turning every failure into a learning moment
|
|
|
Fire drills planned on sunny days
|
Crew drills launched the instant a storm hits
|
Why Inject Chaos After a Real Event
- Validate resilience at the right time.
- Instead of chaos at random, you inject it when a real degradation is already in play.
- Example: API latency is 1.4s (warning) → inject CPU stress → see if autoscaling and retries really protect users.
- Reveal weak spots in remediation.
- Auto-remediation may restart a pod, but what if the DB is also slow?
- Chaos uncovers cascading failures that a single remediation step can’t cover.
- Test SLO guardrails in production-like conditions.
- Injecting stress during live but controlled signals (e.g., warning alerts, not critical) ensures you test under real workloads, not just in lab simulations.
- Build confidence in automation.
- Chaos forces the remediation playbooks, HPA policies, and failover logic to run in real time.
- You validate that remediation is not only coded but also effective under real stress
A Safe Design for Chaos
- Warning-level event → inject chaos (to push the system harder).
- If system + remediation can hold, you know resilience is strong.
- Critical-level event → skip chaos and remediate immediately.
- Protects production and ensures healing takes priority.
Example Use Cases
- High CPU on Application Pods
- Realtime Event: Pod CPU usage > 80% for a sustained period.
- Alert: Prometheus alert for “PodHighCPU.”
- Chaos: Inject CPU stress on one pod to simulate saturation.
- Remediation: Scale deployment replicas or restart the unhealthy pod.
- Node NotReady or Memory Pressure
- Realtime Event: Node marked NotReady or under memory pressure.
- Alert: “NodeNotReady” alert from kubelet metrics.
- Chaos: Drain a node or simulate node failure.
- Remediation: Reschedule pods to healthy nodes or add capacity.
- Database Latency Spike
- Realtime Event: DB query latency exceeds 100ms.
- Alert: “DbHighLatency” alert raised.
- Chaos: Introduce network delay between application and DB.
- Remediation: Switch to a read replica, increase the connection pool, or reroute traffic.
- Increased Error Rate (5xx)
- Real-time event: Error rate > X% in a service.
- Alert: “HighErrorRate” alert triggers.
- Chaos: Kill one pod of the service to simulate degraded availability.
- Remediation: Restart failed pods or scale up to distribute load.
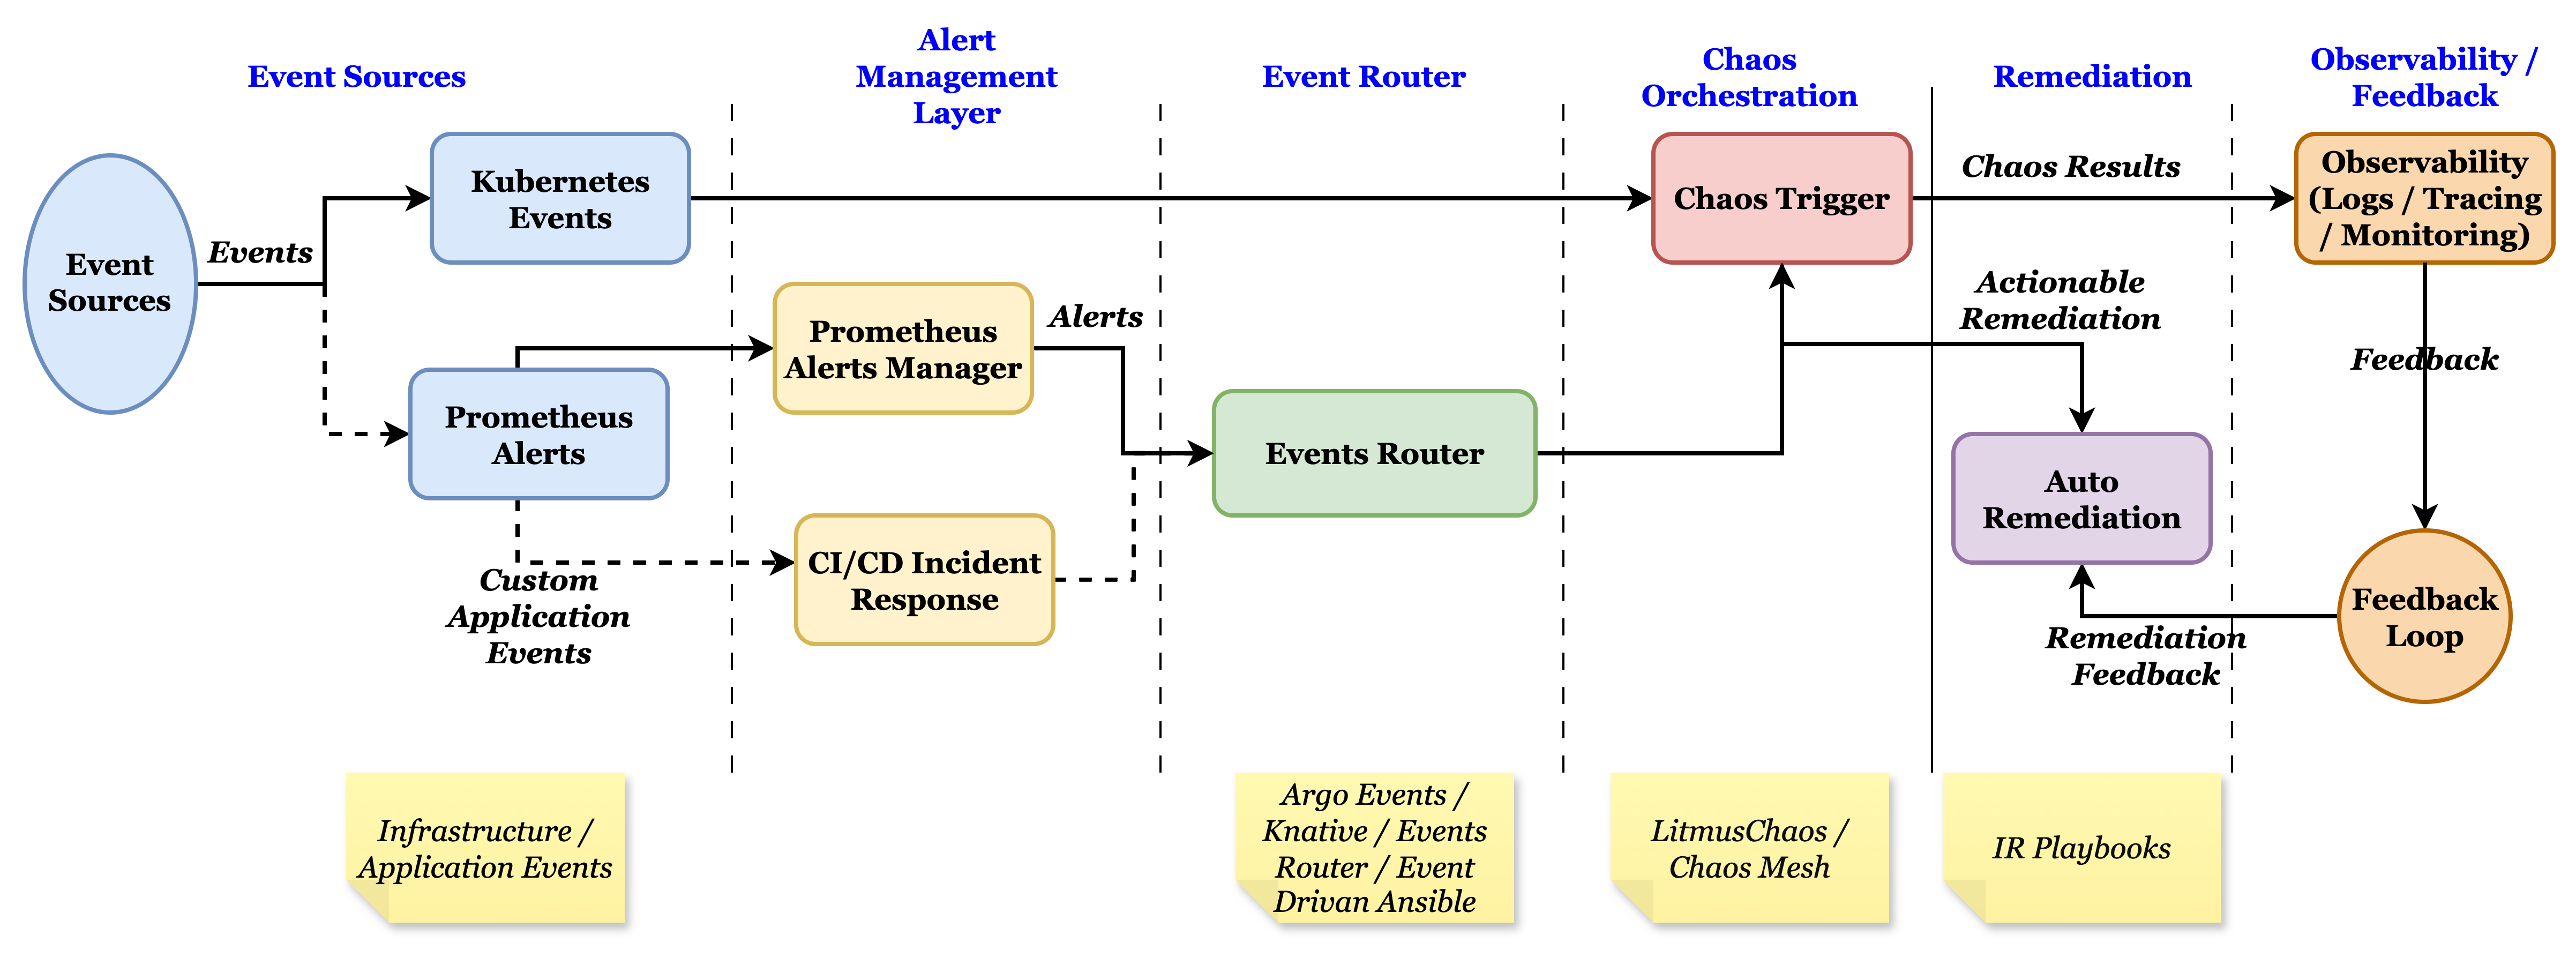
Event-Driven Chaos Engineering Architecture for Kubernetes
The diagram below illustrates an example of an event-driven chaos engineering architecture for a Kubernetes environment. It connects event sources, alert management, event routing, chaos orchestration, remediation, and observability into a closed feedback loop. Our tutorial will be based on this architecture, walking through the layers step by step.
Step-by-Step Tutorial
The prerequisite for this tutorial is a running Kubernetes cluster (Minikube, Kind, or managed cluster). This tutorial uses Minikube and can be used to deploy any cluster. All the YAML files required for this tutorial can be downloaded or cloned from https://github.com/jojustin/EDAChaos.
Step 1: Start Minikube
minikube start --cpus=4 --memory=8192
kubectl get nodes
Step 2: Install ChaosMesh
helm repo add chaos-mesh https://charts.chaos-mesh.org
helm repo update
kubectl create ns chaos-testing
helm install chaos-mesh chaos-mesh/chaos-mesh -n chaos-testing --set chaosDaemon.runtime=docker --set chaosDaemon.socketPath=/var/run/docker.sockkubectl -n chaos-testing get podsStep 3: Deploy a Sample App
Let’s use a simple nginx deployment as our target.
kubectl create deployment nginx --image=nginx
kubectl get pods -n default -l app=nginx -o wide
kubectl expose deployment nginx --port=80 --type=NodePort
minikube service nginx --url   # (optional test)
Make sure all the nginx pods are in a running state.
Step 4: Install Prometheus for Metrics
values-kps.yaml. This file also defines a route webhook to the EDA service DNS.helm repo add prometheus-community https://prometheus-community.github.io/helm-charts
helm repo update
helm install monitoring prometheus-community/kube-prometheus-stack -n monitoring --create-namespace -f values-kps.yaml # Overrides default chart configuration with the custom values providedkubectl get pods -n monitoring
kubectl get crd | grep monitoring.coreos.com # should list prometheusrules, servicemonitors, etc.Step 5: Create a Custom Role to Allow EDA to Read Metrics
Apply it in Kubernetes using kubectl apply -f clusterrole-read-metrics.yaml.
Step 6: Deploy EDA In-Cluster
This step uses a single YAML file that installs Ansible, Ansible Rulebook, and Ansible Galaxy Collection. It also creates an Ansible rulebook, remediation playbook, and other related resources in Kubernetes. remediate.yml is part of eda-incluster.yaml that provides the remediation steps, which can be customized as per the use case. The GitHub token is part of this file, and it can be created as a secret and can be referred. Before running the file, update the fields in the file: github_owner, github_repo, and token. To deploy the EDA listener, apply the files.
# Apply Ruleset & Remediation
kubectl apply -f eda-incluster.yaml

#Roll out the EDA Listener
kubectl -n eda rollout status deploy/eda-listener
Verify the eda-listener pods are in a running state. You can also check the logs.
kubectl -n eda get pods,svc
kubectl -n eda logs deploy/eda-listener -f
Step 7: Ensure a Rule Actually Fires
Create a PrometheusRule defined in the file nginx-high-cpu-rule.yaml that updates Prometheus’ running configuration. Prometheus can evaluate the rule at specified intervals. Apply this rule -> kubectl apply -f nginx-high-cpu-rule.yaml
Optionally, you can port-forward UIs if you want to watch the rule transition using kubectl -n monitoring port-forward svc/monitoring-kube-prometheus-prometheus 9090:9090
Step 8: Include Chaos to Stress the CPU
StressChaos. In a non-production or a testing environment, to manually test the chaos, apply the chaos using the command -kubectl apply -f cpu-stress.yaml.
In a production system for a complete event-driven approach, add a first rule with the run_playbook attribute (part of the ruleset.yaml in the eda-incluster.yaml) to invoke the chaos stress like this:
- name: High CPU alert
  condition: event.alerts[0].labels.alertname == "PodHighCPU"
  action:
    run_playbook:
      name: chaos-cpu-stress.yaml
This invokes the StreeChaos to hike the CPU for the application. In addition to the above, the remediation rule is maintained for the remediation to be invoked.
Step 9: Manual Test Without Waiting for Prometheus
You can post a dummy alert directly to EDA to verify the rule and playbook wiring:
kubectl -n eda port-forward svc/eda-listener 5001:5001

# in another terminal
curl -X POST http://localhost:5001/alerts -H 'Content-Type: application/json' -d '{"alerts":[{"labels":{"alertname":"HighCPUUsage"},"annotations":{"summary":"Test"}}]}'
# should get 202 Accepted; eda logs show playbook runs
Watch the EDA logs.
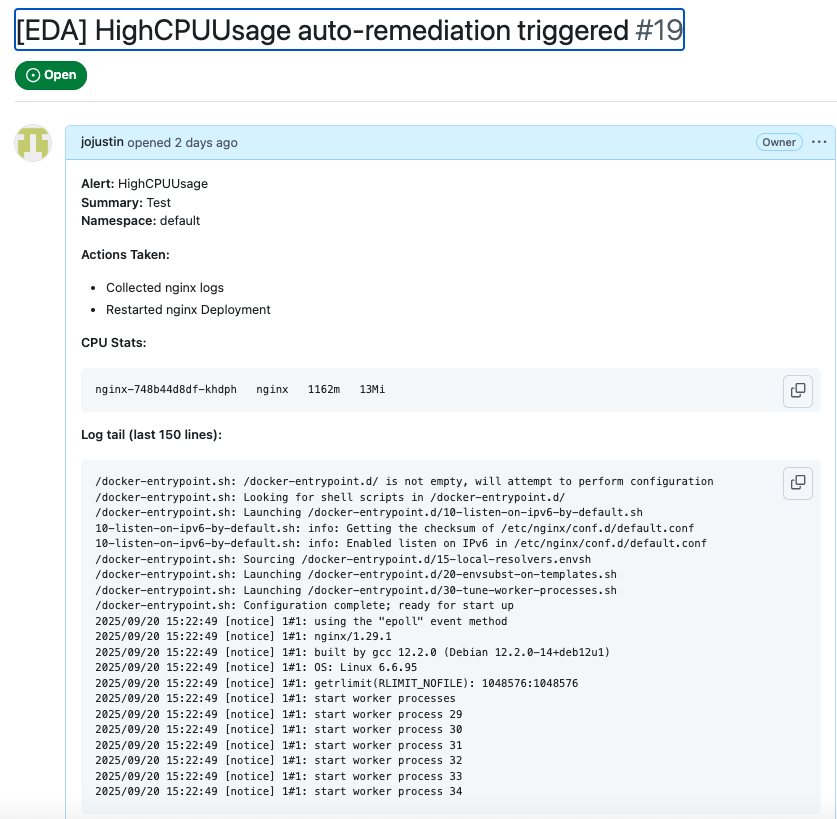
kubectl -n eda logs deploy/eda-listener -fWhen the high CPU event occurs on the nginx-application, defined remediation is applied, and a GIT Summary issue is created when the event occurs. The GIT issue provides the details of the chaos event and the actions taken to remediate. Insights into these details can be used for feedback.
With this hands-on walkthrough, we demonstrated how event-driven Ansible can seamlessly trigger and orchestrate chaos experiments in Kubernetes. By combining ChaosMesh with EDA, Prometheus, and GitHub workflows, we built an automated feedback loop for resilience validation.
Conclusion
Event-driven chaos engineering moves Kubernetes resilience testing from ad hoc failure injection to an automated, intelligent, and continuous practice. By wiring event sources such as Prometheus alerts or Kubernetes signals into event routers and orchestration layers like EDA, teams can trigger chaos experiments exactly when the system is under stress. This not only validates recovery paths but also closes the loop with observability dashboards and feedback into CI/CD pipelines.
The result is a stronger operational posture: instead of fearing failure, organizations learn from it in real time, hardening their platforms against both predictable and unexpected disruptions. In short, event-driven chaos turns failure into actionable insight — and actionable insight into resilience by design.