Asking Claude, ChatGPT or any other advanced LLM “What is AI?” produces a well structured response seemingly in a matter of seconds. But between the user keystrokes, and the first token appearing, a tightly coordinated system is in play to generate this output.
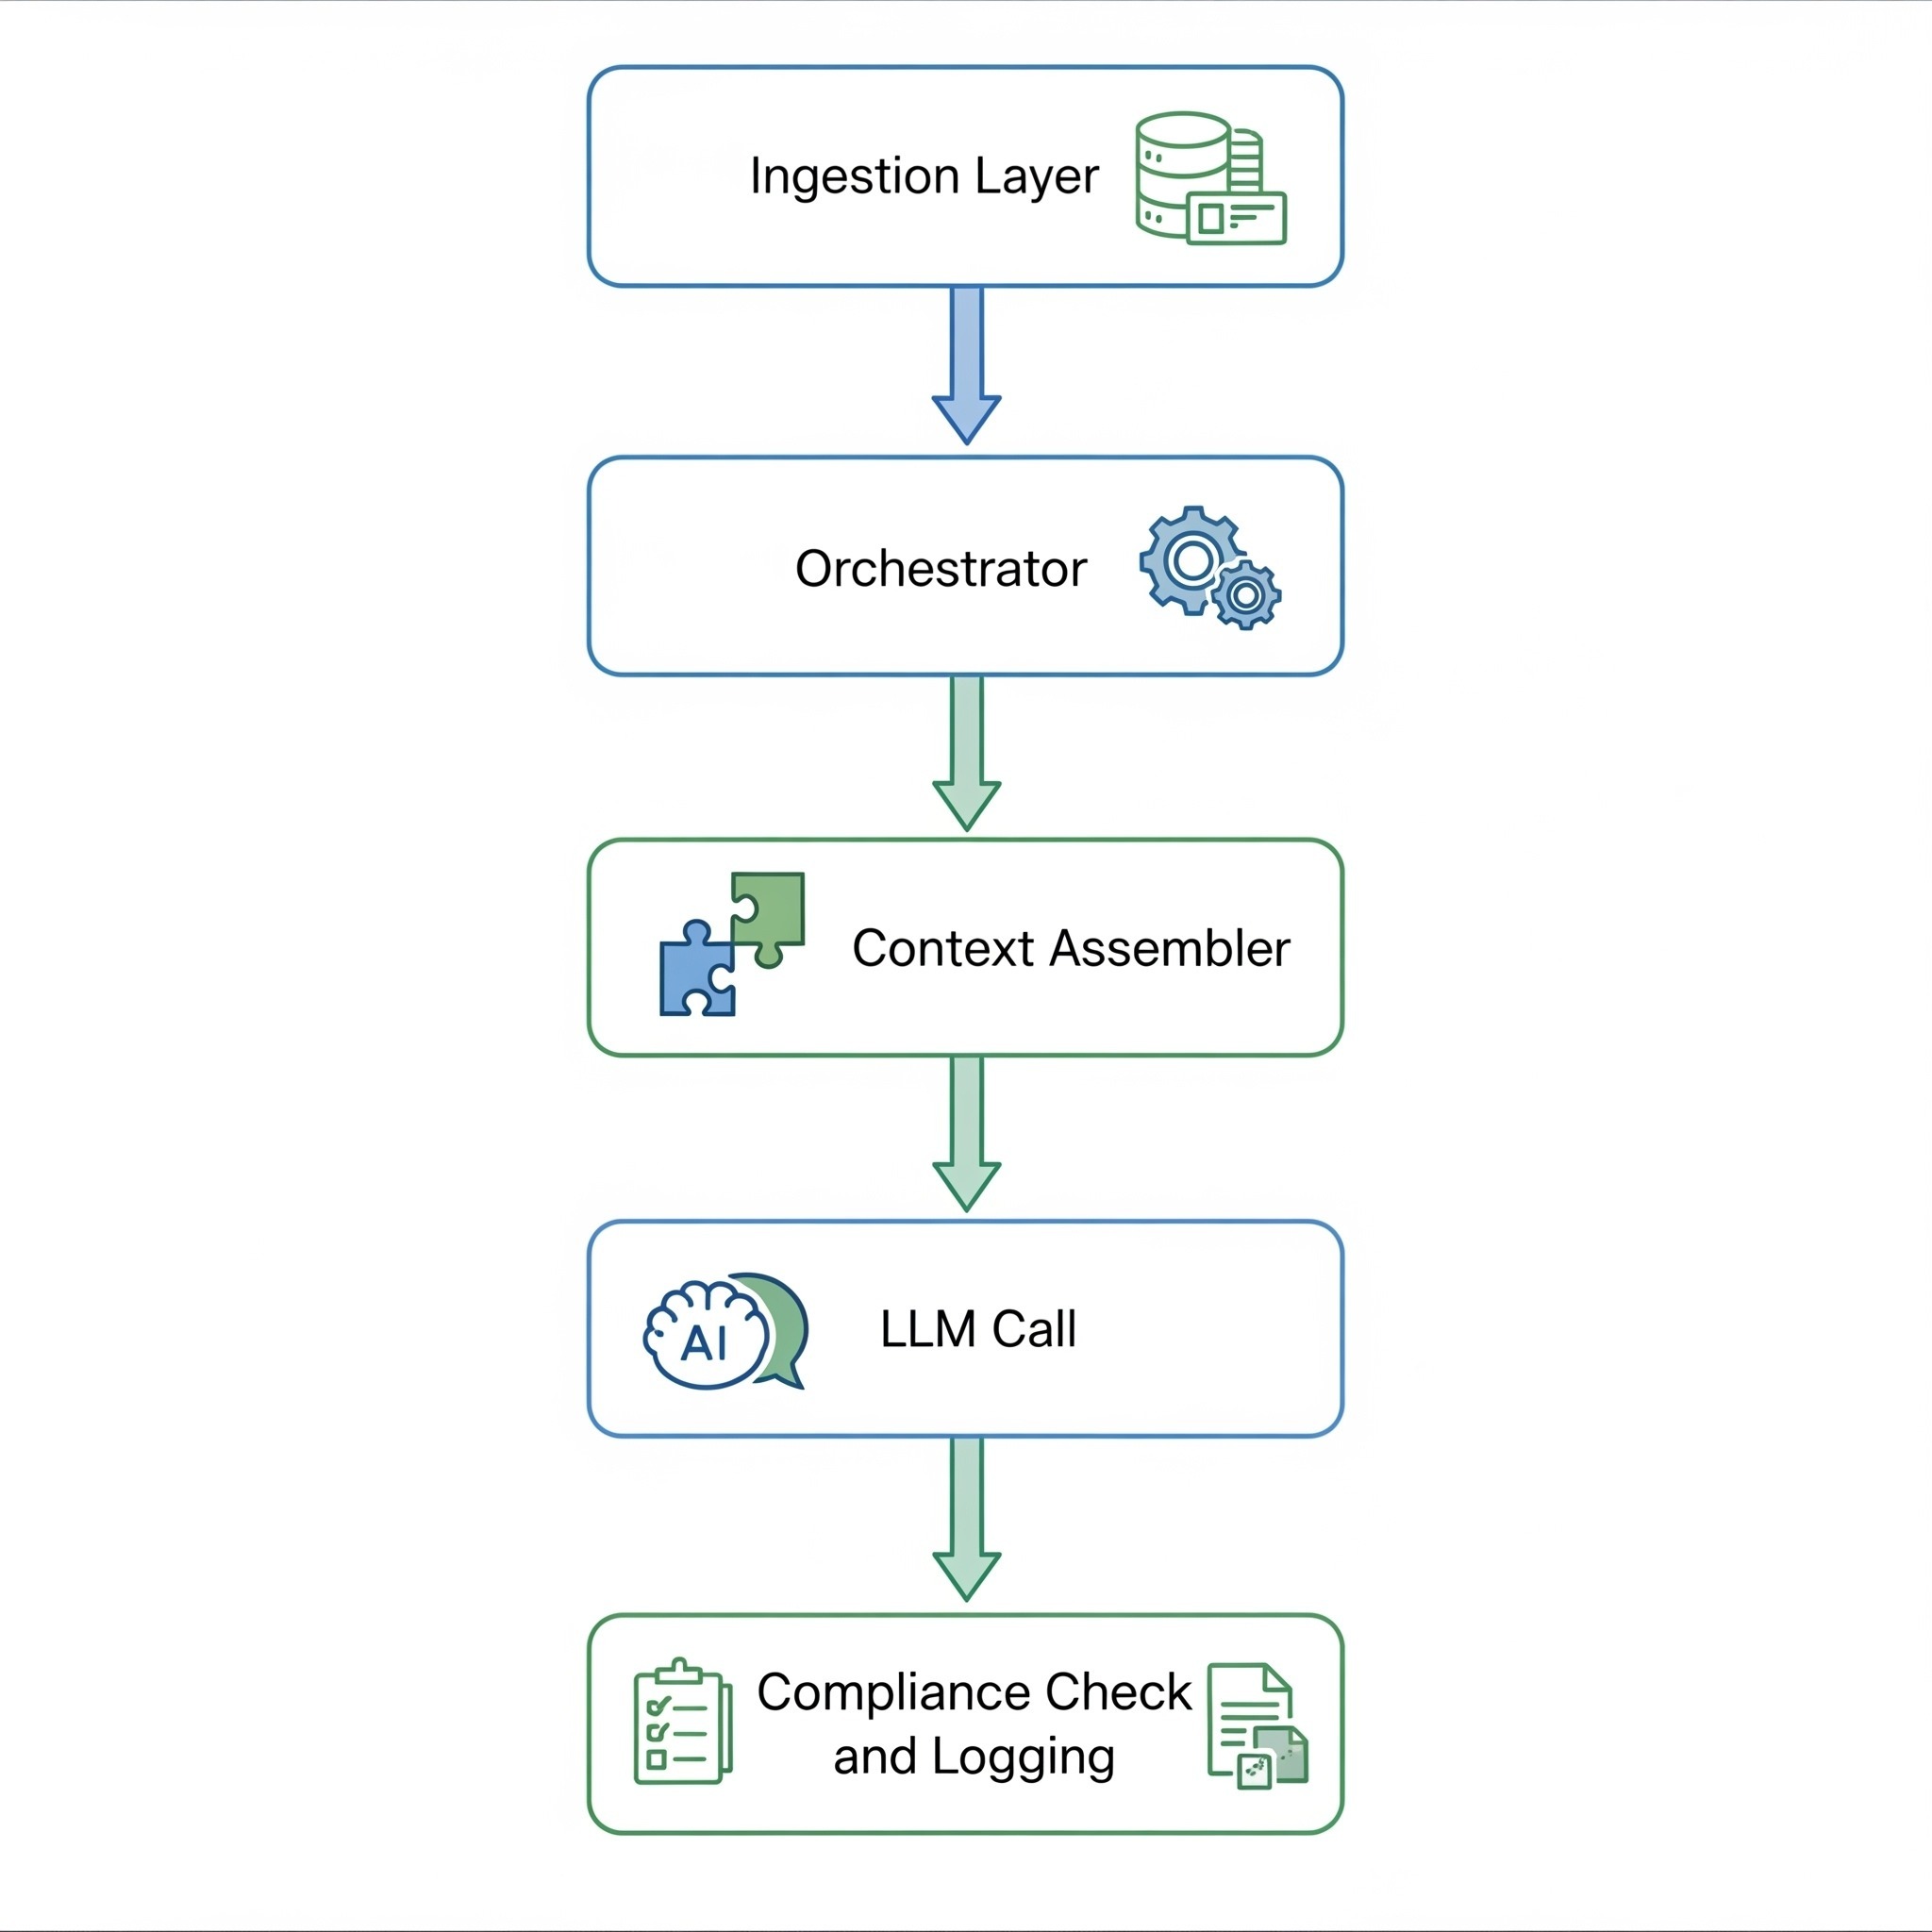
Your request first hits an ingestion layer. It verifies your session, checks rate limits, and runs the query through a trust filter. Your location quietly determines which compliance policies apply. The request is then stamped with a trace ID — an immutable identifier that follows it through every step of execution (this becomes important later).
From there, an orchestrator takes over. It doesn’t just read your message — it interprets intent. Are you looking for a conceptual explanation, a research-style answer, or something more procedural? Based on that, it selects both the model and the strategy for generating a response.
The full prompt is then constructed with the help of a context assembler. It pulls in prior conversation history, layers in user preferences from memory, and shapes everything into something the model can reason over.
Only then is the LLM invoked.
Before a single token is streamed back, the response is checked again for policy and compliance issues. Meanwhile, every step along the way is being recorded — spans nested within spans, each carrying timing data, cost attribution, and links to its parent in the execution chain.
All of this happens under the hood in seconds.
A More Complex Scenario
Now let’s change the question to: “How do I transition from software engineering to product management?”
This is no longer a single, well-formed LLM call.
The system begins to branch. It might fetch course recommendations, look up profiles of people who’ve made similar transitions, scan community discussions, and query external knowledge through a retrieval pipeline. Multiple agents operate at once, reading from and writing to a shared context object. A UI-facing layer, informed by user preferences, decides how the response should be structured and presented.
What comes back is no longer the output of a single model call, but a response synthesized from several agents, tools and reasoning decisions made along the way.
That’s an agentic system in motion. And without proper tracing, it’s operating without visibility.
What to Trace and Why?
Before getting into mechanics, it’s worth being precise about what tracing actually gives you. Simply saying “logs are useful” doesn’t justify the investment.
A more accurate framing: without tracing, improvement is just guesswork, possibly misaligned with the actual state of the system.
Space Timings, for Latency
When a response is slow in an agentic system, the cause is rarely obvious. It could be a delayed model call, an upstream API under load, an agent stuck in a reasoning loop, or work that was executed sequentially when it could have been parallelized.
Tracing separates these scenarios by exposing the critical path — the sequence of spans whose combined latency actually determined the response time — and makes it clear where time is really being spent. Such insights can help determine the “latency hotspots” to target to improve system latency.
Token Counts per Span, for Usage and Cost
In an agentic workflow, cost is not tied to a single computation. One user query can cascade into multiple model calls, each with different context sizes and complexity. Some are essential, some could be nice to have, and a few may simply be mismatched to the task.
With proper tracing, token usage becomes attributable. You can see which agent triggered which call, how much context was included, and whether that cost was justified.
Over time, patterns emerge: query types that are consistently expensive, agents that tend to over-reason or cut corners, or unnecessary use of a larger model where a cheaper one would suffice.
Execution Replay, for Pipeline Debugging
Failures in agentic systems surface as outputs that are subtly wrong, incomplete, or misaligned with intent — not as crashes.
Without a trace, there is no reliable way to understand how that output came to be. With one, you can reconstruct the entire execution: which agents were invoked, what they returned, what context was assembled, and what the model produced before any filtering or formatting.
What would otherwise be guesswork becomes a step-by-step replay — and that replay is also your audit trail when a user or regulator challenges a response.
Model Config and Invocation, for Quality Debugging
When a system produces incorrect or fabricated output, the reason may have nothing to do with the model’s capability. Small parameter choices have outsized effects – like a model temperature set too high for a task that requires precision, a key context missing or a poorly structured prompt.
Tracing the full invocation — model version, parameters, prompt composition, and token usage — makes it possible to connect these inputs to the outputs they produce, and to adjust them with intent rather than trial and error.
Agent Transitions Counters, for Detecting Loops and Inefficient Invocations
Agentic systems introduce failure modes that don’t exist in traditional pipelines. Agents can enter retry loops or bounce between each other without making progress. Each step may appear valid in isolation, but the system as a whole stalls.
Tracing makes these patterns visible as repeated transitions, enabling detection and control through limits, backoff, or circuit breaking — before they become production issues that silently burn through tokens and GPU cycles.
State Mutations, for Shared State Debugging
The hardest bugs in agentic systems are inconsistencies in shared state. When agents share data, critical context can be overwritten, it could be wiped out before being read, it could be read from a stale state for tasks that required precision.
None of these scenarios may produce explicit errors. They produce outputs that appear coherent but slightly off to be subtle enough to be caught.
Without visibility into how the shared state evolved — what changed, when, and which component made the change — these issues are extremely difficult to diagnose. Tracing state mutations provides that missing layer.
Compliance, for Trust and Security
Sensitive data flows through tool outputs, gets assembled into prompts, and surfaces in generated responses. And many things can go wrong there:
- PII exposed where it shouldn’t be,
- A security check skipped, leading to unauthorized access,
- A compliance rule evaluated too late violating legal terms
Tracing validates that the required safeguards actually ran: which policy checks were applied, which ruleset was in effect, and how data was handled at each stage.
This level of visibility is essential for auditing the system behavior and to prevent any compliance issues in production.
Conclusion
Without extensive tracing, an agentic system is effectively a black box making decisions on your behalf. You see the input and the output, but everything in between is opaque.
That makes it difficult to debug, hard to optimize, and nearly impossible to audit with confidence. Tracing changes that. It turns the system into something you can inspect, reason about, and improve with intent.
In Part 2, we’ll move from motivation to implementation: how to structure a trace context that propagates across agent boundaries, what to capture at each step — from orchestration to state mutations to model calls — and how to instrument the kinds of failures that don’t announce themselves, including silent loops, partial updates, and implicit checks like policy enforcement and PII handling.