If your company has budget constraints, purchasing licensed products like Splunk for logging infrastructure may not be feasible. Fortunately, a powerful open-source alternative exists: ELK (Elasticsearch, Logstash, and Kibana). ELK offers robust logging and visualization capabilities.
At a startup where I worked, cost minimization was a priority, so I implemented ELK for logging.
Why Choose ELK?
After thorough research, I decided to implement the ELK stack on GCP using virtual machines (VMs) for logging due to its ease of use, rich dashboards, and straightforward setup process. While I could have deployed it on a GKE cluster, I opted for VMs at the time for various reasons.
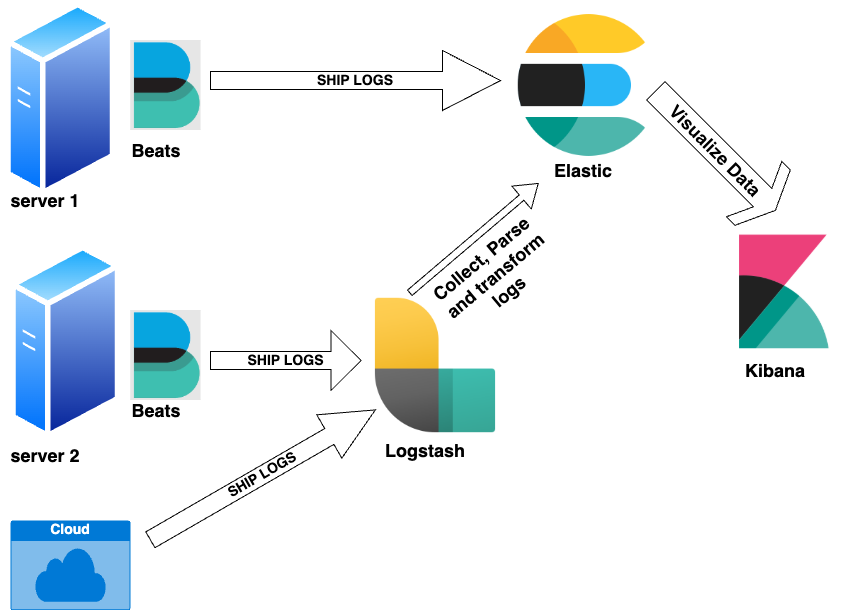
Elasticsearch is an open-source search and analytics engine that allows you to collect and analyze logs from multiple sources, including IoT devices, application servers, web servers, and cloud services. The ELK stack consists of the following components:
-
Elasticsearch – Stores and indexes log data
-
Logstash – Filters and formats logs before ingestion
-
Kibana – Provides a graphical user interface (GUI) for searching and visualizing logs
-
Filebeat – A lightweight log shipper installed as an agent on machines generating logs
Prerequisites
Before setting up ELK, ensure you have the following:
-
A cloud account (Google Cloud, AWS, or Azure). This guide uses GCP.
-
Terraform and Ansible installed on your local machine.
-
Proper authentication configured between your local machine and the cloud provider (Google Cloud or any other) with the required access permissions for Terraform and Ansible.
Part 1: ELK Infrastructure Setup Using Terraform on GCP
-
Master nodes – Manage cluster operations and indexing.
-
Data nodes – Store and index log data for search and analysis.
-
Kibana node – Provides a GUI for log visualization and analytics.
-
Logstash node – Filters, transforms, and ingests logs from various sources.
While all functionalities can be combined on a single node, separating them in a production environment improves scalability and fault tolerance, depending on the workload.
Create the following files in a folder where you plan to run the Terraform code, or clone my Git repository, which contains all the code: GitHub – pradeep-gaddamidi/ELK.
1. create_elk_instances.tf
locals {
  config = var.environment_config[terraform.workspace]
  instances = [for key, value in local.config.nodes : {
    name = key
    machine_type = (
      can(regex("master_.*", value)) ? local.config.master_machine_type :
      can(regex("kibana_.*", value)) ? local.config.kibana_machine_type :
      can(regex("logstash_.*", value)) ? local.config.logstash_machine_type :
      local.config.node_machine_type
    )
    zone = (
      can(regex(".*_zoneb", value)) ? local.config.region_zones[1] :
      can(regex(".*_zonec", value)) ? local.config.region_zones[2] :
      local.config.region_zones[0]
    )
    network_tags         = local.config.network_tags
    ssh_keys      = local.config.ssh_keys
    static_ip_name       = key           # Modify or leave null as needed
    service_account_name = "elastic"     # Modify or leave null as needed
    disk_name            = key           # Modify or leave null as needed
    disk_type            = "pd-standard" # Modify as needed
    disk_size = (
      can(regex("master_.*", value)) ? local.config.master_disk_size :
      can(regex("kibana_.*", value)) ? local.config.kibana_disk_size :
      can(regex("logstash_.*", value)) ? local.config.logstash_disk_size :
      local.config.node_disk_size
    )
    disk_zone = (
      can(regex(".*_zoneb", value)) ? local.config.region_zones[1] :
      can(regex(".*_zonec", value)) ? local.config.region_zones[2] :
      local.config.region_zones[0]
    )
    disk_project = local.config.project_name
  }]
}

module "gcp_instance" {
  source                = "../../modules/gcp_custom_instance"
  gce_image             = local.config.gce_image
  subnet                = local.config.subnet
  region                = local.config.region  # Provide only when creating static IPS
  instances             = local.instances
  use_common_service_account = local.config.use_common_service_account # Provide only when creating a common service account accross all the instances
}
2. variables.tf
variable "environment_config" {
  description = "Configuration per environment"
  type = map(object({
    project_name         = string
    region               = string
    region_zones         = list(string)
    master_machine_type  = string
    node_machine_type    = string
    kibana_machine_type  = string
    logstash_machine_type= string
    network_tags         = list(string)
    network              = string
    subnet               = string
    gce_image            = string
    ca_bucket_location   = string
    backup_bucket        = string
    master_disk_size     = number
    node_disk_size       = number
    kibana_disk_size     = number
    logstash_disk_size   = number
    use_common_service_account = bool
    machine_access_scopes= list(string)
    nodes                = map(string)
    ssh_keys             = list(string)
  }))
  default = {
    nonprod = {
      project_name         = "nonprod-infra-monitoring"
      region               = "us-central1"
      region_zones         = ["us-central1-a", "us-central1-b"]
      master_machine_type  = "n1-standard-2"
      node_machine_type    = "n1-standard-2"
      kibana_machine_type  = "n1-standard-2"
      logstash_machine_type= "n1-standard-2"
      network_tags         = ["elastic", "nonprod"]
      network              = "projects/nonprod-networking/global/networks/nonprod-vpc"
      subnet               = "projects/nonprod-networking/regions/us-central1/subnetworks/nonprod-sub01"
      gce_image            = "debian-cloud/debian-12"
      ca_bucket_location   = "nonprod-elastic-certificates"
      backup_bucket        = "nonprod-elastic-backup"
      master_disk_size     = 100
      node_disk_size       = 510
      kibana_disk_size     = 100
      logstash_disk_size   = 100
      use_common_service_account = true
      machine_access_scopes = ["cloud-platform"]
      ssh_keys              = []
      nodes = {
        "nonprod-elastic-master-node1" = "master_zonea"
        "nonprod-elastic-data-node1"   = "data_zonea"
        "nonprod-elastic-data-node2"   = "data_zoneb"
        "nonprod-elastic-kibana"       = "kibana_zonea"
        "nonprod-elastic-logstash"     = "logstash_zonea"
      }
    }
    prod = {
      project_name         = "prod-infra-monitoring"
      region               = "us-central1"
      region_zones         = ["us-central1-a", "us-central1-b", "us-central1-c"]
      master_machine_type  = "n2-standard-2"
      node_machine_type    = "n2-highmem-4"
      kibana_machine_type  = "n2-standard-2"
      logstash_machine_type= "n2-standard-2"
      network_tags         = ["elastic", "prod"]
      network              = "projects/prod-networking/global/networks/prod-vpc"
      subnet               = "projects/prod-networking/regions/us-central1/subnetworks/prod-sub01"
      gce_image            = "debian-cloud/debian-12"
      ca_bucket_location   = "prod-elastic-certificates"
      backup_bucket        = "prod-elastic-backup"
      master_disk_size     = 100
      node_disk_size       = 3000
      kibana_disk_size     = 100
      logstash_disk_size   = 100
      use_common_service_account = true
      machine_access_scopes = ["cloud-platform"]
      ssh_keys              = []
      nodes = {
        "elastic-master-node1" = "master_zonea"
        "elastic-master-node2" = "master_zoneb"
        "elastic-master-node3" = "master_zonec"
        "elastic-data-node1"   = "data_zonea"
        "elastic-data-node2"   = "data_zonea"
        "elastic-data-node3"   = "data_zoneb"
        "elastic-data-node4"   = "data_zoneb"
        "elastic-data-node5"   = "data_zonea"
        "elastic-data-node6"   = "data_zoneb"
        "elastic-kibana"       = "kibana_zonea"
        "elastic-logstash"     = "logstash_zonea"
        "elastic-logstash2"     = "logstash_zoneb"
        "elastic-logstash3"    = "logstash_zonec"
      }
    }
  }
}
I have created a custom module to provision GCP instances and used it in the
create_elk_instances.tf file. However, you can also use GCP’s official Terraform module to create VM instances.
module "gcp_instance" {
  source                = "./modules/gcp_custom_instance"
The
./modules/gcp_custom_instance folder must have the files, gcp_custom_vm.tf and variables_custom.tf).
Below is the code for my custom module:
3. gcp_custom_vm.tf
4. variables_custom.tf
variable "instances" {
  description = "List of instance configurations"
  type = list(object({
    name                = string
    machine_type        = string
    zone                = string
    network_tags        = optional(list(string))
    ssh_keys	        = optional(list(string))
    static_ip_name      = optional(string)
    service_account_name = optional(string)
    disk_name           = optional(string)
    disk_type           = optional(string)
    disk_size           = optional(number)
    disk_zone           = optional(string)
    disk_project        = optional(string)
  }))
}

variable "gce_image" {
  description = "GCE image for the instances"
  type        = string
  default     = "debian-cloud/debian-12"
}

variable "subnet" {
  description = "Subnet for the network"
  type        = string
}

variable "region" {
  description = "GCP region"
  type        = string
  default     = "us-central1"
}

variable "use_common_service_account" {
  description = "Flag to determine if a common service account should be used for all instances"
  type        = bool
  default     = false
}

variable "machine_access_scopes" {
  description = "Scopes for machine access"
  type        = list(string)
  default     = ["cloud-platform"]
}
Assign permissions to the service accounts created earlier in the code:
locals {
  bucket_config = var.environment_config[terraform.workspace]
}

resource "google_storage_bucket_iam_binding" "elastic-backup" {
  bucket  = local.bucket_config.backup_bucket
  role    = "roles/storage.objectAdmin"
  members = local.config.use_common_service_account ? ["serviceAccount:${module.gcp_instance.common_service_account_email}"] : []
}

resource "google_storage_bucket_iam_binding" "elastic-certs" {
  bucket  = local.bucket_config.ca_bucket_location
  role    = "roles/storage.objectViewer"
  members = local.config.use_common_service_account ? ["serviceAccount:${module.gcp_instance.common_service_account_email}"] : []
}
Create the GCP buckets used for certificates and elastic backups:
resource "google_storage_bucket" "elastic-backup" {
  name          = local.bucket_config.backup_bucket
  location      = "US"
  storage_class = "STANDARD"

  uniform_bucket_level_access = true
}
resource "google_storage_bucket" "elastic-certs" {
  name          = local.bucket_config.ca_bucket_location
  location      = "US"
  storage_class = "STANDARD"

  uniform_bucket_level_access = true
}
You can use the below Terraform commands to create the above resources:
terraform workspace set nonprod (if you use workspaces)
terraform init
terraform plan
terraform apply
You can add new nodes as needed by updating variables, i.e., adding new nodes to the nodes section of the file and re-running the Terraform code. This will provision the new data nodes automatically. Now that the ELK infrastructure is set up, the next step is to install and configure the ELK software.
Part 2: Configure the ELK Infrastructure Using Ansible
Prerequisites
1. The certificate generation required for secure communication between various Elastic nodes can be automated. However, I chose to generate them manually by following the ELK guides.
Once the certificates are generated, stage them on the GCP bucket elastic-certificates.
2. Make sure your Ansible hosts files are organized as below:
-
All data and master nodes are grouped under the
elasticsection -
Kibana nodes under
kibanasection -
Logstash nodes under
logstash -
Data nodes under
data -
Master nodes under
master
Create the following files in a folder where you plan to run the Ansible playbook. Then, execute the Ansible playbook below to install and configure ELK.
ansible.yaml
---
- name: Install Elasticsearch pre-reqs on Debian
  hosts: all
  become: yes
  tasks:
    - name: Update apt repository
      apt:
        update_cache: yes

    - name: Install default-jre
      apt:
        name:
          - default-jre
        state: present

    - name: Add Elasticsearch GPG key
      apt_key:
        url: https://artifacts.elastic.co/GPG-KEY-elasticsearch
        state: present

    - name: Install apt-transport-https
      apt:
        name: apt-transport-https
        state: present

    - name: Add Elasticsearch repository
      apt_repository:
        repo: "deb https://artifacts.elastic.co/packages/8.x/apt stable main"
        state: present
        filename: elastic-8.x

    - name: Update apt repository
      apt:
        update_cache: yes

- name: Install Elasticsearch on Debian
  hosts: elastic
  become: yes
  tasks:
    - name: Install Elasticsearch
      apt:
        name: elasticsearch=8.11.2
        state: present
    - name: Enable Elasticsearch service
      ansible.builtin.systemd:
        name: elasticsearch.service
        enabled: yes

- name: Install Kibana on Debian
  hosts: kibana
  become: yes
  tasks:
    - name: Install Kibana
      apt:
        name: kibana=8.11.2
        state: present
    - name: Enable kibana service
      ansible.builtin.systemd:
        name: kibana.service
        enabled: yes

- name: Install logstash on Debian
  hosts: logstash
  become: yes
  tasks:
    - name: Install logstash
      apt:
        name: logstash=1:8.11.2-1
        state: present
    - name: Enable logstash service
      ansible.builtin.systemd:
        name: logstash.service
        enabled: yes

- name: Copy the kibana.yml configuration file to the kibana nodes
  hosts: kibana
  become: yes
  tasks:
    - name: Copy a kibana.yml file
      template:
        src: "{{ playbook_dir }}/files/kibana.j2"
        dest: /etc/kibana/kibana.yml

- name: Copy the pipelines.yml configuration file to the logstash nodes
  hosts: logstash
  become: yes
  tasks:
    - name: Copy a logstash pipelines.yml file
      template:
        src: "{{ playbook_dir }}/files/logstash.j2"
        dest: /etc/logstash/conf.d/pipelines.conf

- name: Copy the elasticsearch_node.yml configuration file to the nodes
  hosts: data
  gather_facts: yes
  become: yes
  tasks:
    - name: Get zone info from metadata server
      ansible.builtin.uri:
        url: http://metadata.google.internal/computeMetadata/v1/instance/zone
        method: GET
        return_content: yes  # Ensures that the content is returned
        headers:
          Metadata-Flavor: "Google"
      register: zone_info
      check_mode: no
    - name: Extract the zone name
      set_fact:
        zone_name: "{{ zone_info.content.split('/')[-1] }}"
    - name: Copy a elasticsearch_node.yml file
      template:
        src: "{{ playbook_dir }}/files/elasticsearch_node.j2"
        dest: /etc/elasticsearch/elasticsearch.yml

- name: Copy the elasticsearch_node.yml configuration file to the nodes
  hosts: master
  gather_facts: yes
  become: yes
  tasks:
    - name: Copy a elasticsearch_master.yml file
      template:
        src: "{{ playbook_dir }}/files/elasticsearch_master.j2"
        dest: /etc/elasticsearch/elasticsearch.yml
- name: Download the certificates from the GCS bucket
  hosts: elastic
  become: yes
  tasks:
    - name: certificates
      command: gsutil cp gs://nonprod-elastic-certificates/* /etc/elasticsearch/certs
- name: Download the certificates from the GCS bucket
  hosts: kibana
  become: yes
  tasks:
    - name: certificates
      command: gsutil cp gs://nonprod-elastic-certificates/elasticsearch-ca.pem /etc/kibana

- name: Download the certificates from the GCS bucket
  hosts: logstash
  become: yes
  tasks:
    - name: certificates
      command: gsutil cp gs://nonprod-elastic-certificates/elasticsearch-ca.pem /usr/share/logstash/pipeline/elasticsearch-ca.pem
The configuration files required by the Ansible playbook should be placed in the files directory. The expected files are listed below:
1. elasticsearch_master.j2
node.name: {{ ansible_default_ipv4.address }}
node.roles: [ master ]
discovery.seed_hosts:
 - 10.x.x.x
 - 10.x.x.x
 - 10.x.x.x
#cluster.initial_master_nodes:
# - 10.x.x.x
# - 10.x.x.x
# - 10.x.x.x
network.host : {{ ansible_default_ipv4.address }}
cluster.name: prod-monitoring
path:
  data: /mnt/disks/elasticsearch
  logs: /var/log/elasticsearch
cluster.routing.allocation.awareness.attributes: zone
cluster.routing.allocation.awareness.force.zone.values: us-central1-a,us-central1-b
xpack.security.http.ssl.enabled: true
xpack.security.http.ssl.keystore.path: /etc/elasticsearch/certs/http.p12
xpack.security.enabled: true
xpack.security.transport.ssl.enabled: true
xpack.security.audit.enabled: true
xpack.security.transport.ssl.verification_mode: certificate
xpack.security.transport.ssl.keystore.path: /etc/elasticsearch/certs/elastic-certificates.p12
xpack.security.transport.ssl.client_authentication: required
xpack.security.transport.ssl.truststore.path: /etc/elasticsearch/certs/elastic-certificates.p12
xpack.license.self_generated.type: basic
A few points to be noted about the above elastic master nodes configuration:
-
We are using a basic (free) license, not a premium one.
-
When Ansible runs on the master node, it automatically fills in the IPv4 address of the master node by default.
-
Uncomment
cluster.initial_master_nodesonly when creating the cluster for the first time. -
Security is enabled between:
- Master nodes using
xpack.security.transport.ssl.enabled - Data nodes and Kibana/Logstash using
xpack.security.http.ssl.enabled
- Master nodes using
2. elasticsearch_node.j2
node.name: {{ ansible_default_ipv4.address }}
node.roles: [ data, transform, ingest ]
discovery.seed_hosts:
 - 10.x.x.x
 - 10.x.x.x
 - 10.x.x.x
#cluster.initial_master_nodes:
# - 10.x.x.x
# - 10.x.x.x
# - 10.x.x.x
network.host : {{ ansible_default_ipv4.address }}
cluster.name: prod-monitoring
path:
  data: /mnt/disks/elasticsearch
  logs: /var/log/elasticsearch
node.attr.zone: {{ zone_name }}
xpack.security.http.ssl.enabled: true
xpack.security.http.ssl.keystore.path: /etc/elasticsearch/certs/http.p12
xpack.security.enabled: true
xpack.security.transport.ssl.enabled: true
xpack.security.audit.enabled: true
xpack.security.transport.ssl.verification_mode: certificate
xpack.security.transport.ssl.keystore.path: /etc/elasticsearch/certs/elastic-certificates.p12
xpack.security.transport.ssl.client_authentication: required
xpack.security.transport.ssl.truststore.path: /etc/elasticsearch/certs/elastic-certificates.p12
xpack.license.self_generated.type: basic
3. kibana.j2
elasticsearch.hosts: ["https://10.x.x.x:9200","https://10.x.x.x:9200","https://10.x.x.x:9200","https://10.x.x.x:9200"]
server.name: kibana
server.host: {{ ansible_default_ipv4.address }}
server.port: 443
elasticsearch.username: 'kibana_system'
elasticsearch.password: 'somepassxxxxx'
elasticsearch.ssl.certificateAuthorities: ['/etc/kibana/elasticsearch-ca.pem']
elasticsearch.ssl.verificationMode: 'certificate'
server.ssl.enabled: true
server.ssl.certificate: /etc/ssl/kibana/kibana-cert.crt
server.ssl.key: /etc/ssl/kibana/kibana-key.key
server.publicBaseUrl: https://elastic.company.xyz
xpack.encryptedSavedObjects.encryptionKey: zxy123f1318d633817xyz1234
xpack.reporting.encryptionKey: 1xfsyc4ad24176a902f2xyz123
xpack.security.encryptionKey: cskcjsn60e148a70308d39dxyz123
logging:
  appenders:
    file:
      type: file
      fileName: /var/log/kibana/kibana.log
      layout:
        type: json
  root:
    appenders:
      - default
      - file
pid.file: /run/kibana/kibana.pid
4. logstash.j2
A few points to be noted about the above logstash configuration:
-
In the Logstash configuration above, we use various filters such as
grok,date,kv, andmutateto match and modify incoming logs. Adjust according to your needs. -
In both
kibana.j2andlogstash.j2, for “elasticsearch.hosts”, you can specify all data nodes as a list, allowing requests to be round-robin distributed across them. Alternatively, configure an internal load balancer with data nodes as the backend and provide just the load balancer’s IP. -
Ensure that the
indexandlogstash_writerusers are created via the Kibana console. Additionally, configure the necessary indices to ingest data from other sources like Filebeat and assign proper permissions to the respective users. -
Data can be ingested into Elasticsearch via Logstash, allowing for necessary filtering, or it can be sent directly to data nodes using agents like Filebeat.
-
If you are storing any of the above
.j2Jinja files in a Git repository, and they contain sensitive information, encrypt them usingansible-vault. Refer to the Ansible documentation to learn more about usingansible-vault.
filebeat.conf
logging.json: true
logging.level: info
logging.metrics.enabled: false

setup.kibana.host: ${KIBANA_HOST}
setup.ilm.enabled: true

output.elasticsearch:
  hosts: ${ELASTIC_HOST}
  indices:
    - index: "audit-%{+yyyy.MM.dd}"
      when.has_fields: ["_audit"]
    - index: "logs-%{+yyyy.MM.dd}"
      when.has_fields: ["app", "env"]
    - index: "invalid-stream-%{+yyyy.MM.dd}"
      when.has_fields: ["error.data", "error.message"]

filebeat.autodiscover:
  providers:
    - type: docker
      templates:
        - config:
            - type: container
              paths:
                - /var/lib/docker/containers/${data.docker.container.id}/*.log

processors:
  - decode_json_fields:
      fields: ["message"]
      process_array: false
      max_depth: 1
      target: ""
      overwrite_keys: false
      add_error_key: true
Once ELK is set up, you can configure data backups called snapshots to the ‘elastic-backup’ GCS bucket via the Kibana console.
Conclusion